Problem gambling: Is it rising and how much is it costing?
 BBC
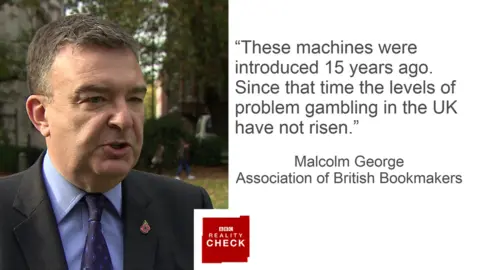
BBCAs the government considered what to do about fixed-odds betting terminals last week, Malcolm George, chief executive of the Association of British Bookmakers was discussing whether they were really a problem.
"These machines were introduced 15 years ago. Since that time the levels of problem gambling in the UK have not risen," he said.
The machines became widespread after changes to the taxation on gambling in October 2001. There are now more than 34,000 of them. They generated a gross gambling yield (GGY) of £1.8bn between October 2015 and September 2016 (GGY is the measure of all money staked minus the amount paid out).
To put that into context, it's about 13% of the GGY of the UK gambling industry as a whole.
The figures Mr George is referring to come from the industry regulator, the Gambling Commission. At first glance, they do look statistically stable, with 0.6% problem gamblers in 1999 and either 0.6%, 0.7% or 0.8% in 2015.
But there are considerable reasons to believe that these figures are not comparable.
The Gambling Commission says the questions asked over the period were pretty similar, but that three different methodologies had been used, so they should not be seen as a continuous trend.
The reason for the uncertainty about the 2015 figure is that it depends what measure of problem gambling you are using.
The 1999 figure is based on Diagnostic and Statistical Manual of Mental Disorders, which is the American Psychiatric Association's (APA) methodology.
The 0.7% figure in 2015 is also from the APA method (although collected differently, which is why it is not comparable) while the 0.6% is based on the Problem Gambling Severity Index. The 0.8% is people who show up as problem gamblers by either method.
Under the circumstances and given the Gambling Commission's caveats, it is reasonable to conclude that we do not know whether problem gambling is more or less of a problem than it was 15 years ago.
While it is difficult to compare over such a long time, it is possible to compare problem gambling across types.
The latest report from NatCen says the lowest levels of problem gambling were found among those who took part in the National Lottery - 1.3% of them were problem gamblers.
The top five activities with the highest proportions of problem gamblers were:
- Spread betting 20.1%
- Betting exchanges 16.2%
- Playing poker in pubs or clubs 15.9%
- Betting on events with a bookmaker (not online) 15.5%
- Playing machines in bookmakers 11.5%.

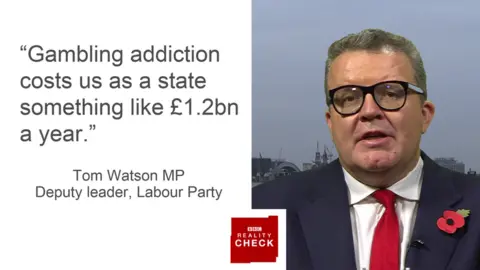
Another claim came from Labour deputy leader Tom Watson who said figures show that gambling addiction costs the economy £1.2bn a year.
The figure actually comes from the IPPR think tank and is the top end of a huge range. "People who are problem gamblers are associated with between £260m and £1.2bn a year of extra cost to government," the report says.
Such a big range would already be setting off alarm bells if the report did not warn: "Due to limitations in the available data, these findings should not be taken as the excess fiscal cost caused by problem gambling."
There is plenty of interesting analysis of the costs created by problem gambling including things like crime and extra benefits, but it is not reasonable to use this as an excess cost to the government and certainly not only to use the top of the range.


